A dedicated source of market insights and product developments from the largest network of specialised providers of maritime data and analytics.
Section 301 imminent 🇺🇸 Comoros Dark Fleet Purge Sees More Than 60 Tankers Listed as False Flagged 🔦 Coal Market Insights – September 2025: Shifting Flows Reshape Global Trade 🚢
|
Maritimedata.ai is a single source of access to 200+ data services. 200+ Products 60+ Maritime Intelligence Providers 30+ Years of Experience Insights 📈Oil & Gas 🛢️
Dry 🚢
Other 🌎
Section 301 imminent - GibsonsIn April, the Office of the United States Trade Representative (USTR) published their much-anticipated action plan to address alleged Chinese maritime dominance. Few further details have come to light since, and significant uncertainty remains around details of the policy. The measures are scheduled to come into effect soon, on the 14th of October, after a phase in period of 180 days. For a more detailed account of the policy, please refer to our report from April. Briefly, fees are planned to be imposed for making port calls in the US based on whether a vessel is Chinese built or Chinese owned or operated. For a Chinese owned or operated vessel, an initial tariff of $50 per net tonne (NT) per port call or rotation of US port calls applies, with no exemptions, increasing over the next three years. These vessels would in effect be excluded from the US market, as the costs incurred would make these vessels uncompetitive. For Chinese built, but not owned or operated vessels, the measures are more complex as various exemptions may apply. Regardless of vessel size, if the tanker arrives in ballast, the voyage is less than 2000nm, the vessel is less than 55,000 dwt, or it is US beneficially owned, no fees will apply. Note that the 80,000 dwt bulk capacity threshold exemption hasn’t been clarified, though it is mostly interpreted as applying only to dry bulk vessels below 80,000 dwt. Provided none of these exemptions apply, US port calls on a Chinese built vessel would be impacted, and a fee of $18/NT is set which is also set to increase over the next three years. Significant uncertainty remains around details, including any potential costs incurred or avoided by re-berthing or discharging via STS. As it stands, vessels subject to Chinese lease financing are expected to be classified as Chinese owned, and here a significant impact has already been felt. Substantial efforts to diversify away from facilities with Chinese lessors have been seen in recent months, as lessors are facing early repayments and lower demand. Law firms are exploring structures to retain Chinese lease facilities and circumvent the Section 301 regulations, though a readily applicable solution has yet to be found. The total numbers of vessels affected depends on what definition is used for Chinese owned or operated. If the definition is applied liberally, around 19% of the tanker fleet greater than 25,000 dwt are Chinese owned or operated, though most of these operate East of Suez and are unlikely to trade to the US. We are currently counting over 500 tankers on the water above 55,000 dwt which are Chinese built but not Chinese owned or operated, of which again most are trading East of Suez. Note that these are indicative numbers, as the USTR’s definition of owner or operator of a vessel is yet to be fully clarified. Further, nearly 70% of the current tanker orderbook greater than 25,000 dwt is on order in China.
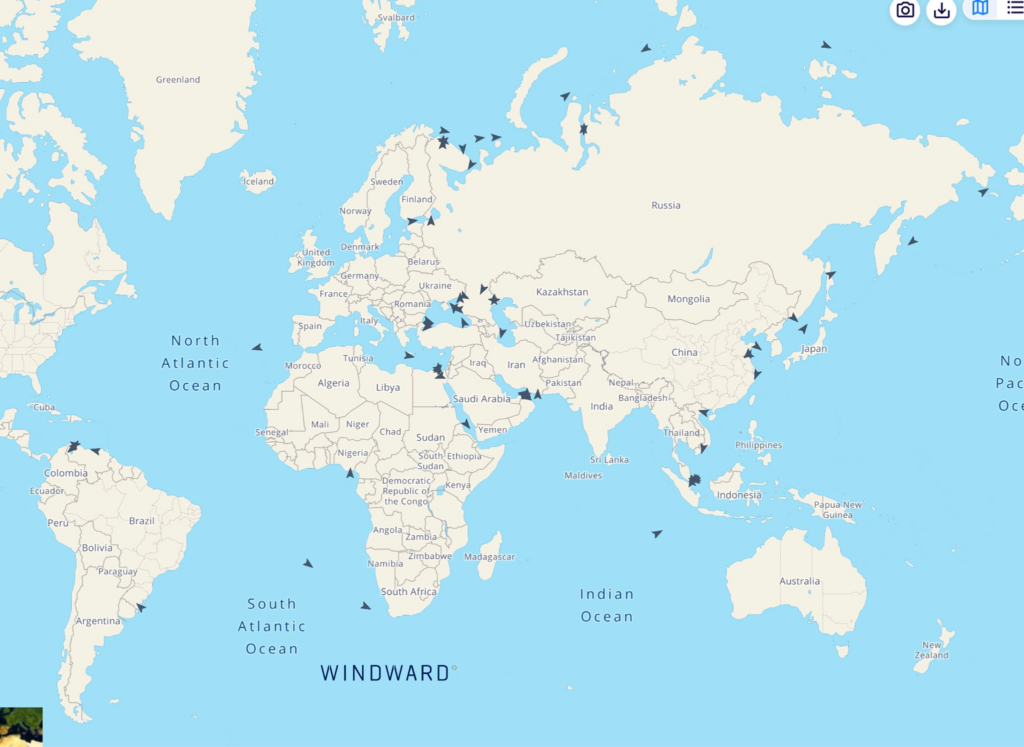
Comoros Dark Fleet Purge Sees More Than 60 Tankers Listed as False Flagged - WindwardThe government of Comoros has begun a clean-out of its international flag registry which has been central to sanctions-circumventing dark fleet tankers shipping Russian, Iranian and Venezuelan oil. There are now 62 tankers, three liquefied petroleum gas carriers and one tug declared as falsely flying the Comoros flag, according to the EU’s Equasis database. Ships are labeled by the International Maritime Organization as falsely flagged once confirmed by the flag administration that it is not legally registered with that country’s flag. All but one of the falsely flagged Comoros ships was sanctioned by either the US, EU or UK and engaged in Russia, Iranian or Venezuelan trades as of September 14, Windward data show.
False Flag Networks Aid Sanctions EvasionFlag governance has emerged as critical for countering the dark fleet of sanctions-circumventing tankers which have exploited lax technical oversight and management at privately run registries. Comoros, along with Gambia and Sierra Leone, are among the biggest providers of ship registry services to sanctioned tankers, as permissive flags such as Gabon, Barbados, Cook Islands, Panama, and others expel them from their fleets — triggering record levels of flag hopping among dark fleet vessels. Windward research in August showed that Comoros flagged 38% of sanctioned dark fleet tonnage over 20,000 dwt that was not falsely flagged, followed by Gambia, Cameroon and Sierra Leone. 57% of sanctioned tonnage was falsely flagged, or the flag was unknown. These numbers will be higher now that Equasis has added more than 60 Comoros tankers to the false-flag list. Their false flag status was backdated to May for most of the ships with a handful declared falsely flagged in July and August.
Coal Market Insights – September 2025: Shifting Flows Reshape Global Trade - Signal OceanGlobal PerspectiveGlobal coal demand reached 8.79 billion tons in 2024, marking a new record. According to the IEA’s Coal Mid-Year Update 2025 (July, 2025), consumption is expected to plateau at similar levels in 2025, reflecting a critical shift. . In China, coal demand fell by around 0.5% in the first half of 2025, as electricity demand growth slowed and renewable generation expanded. This contraction, alongside a 3% decline in coal-fired power generation, suggests that China is entering a phase where renewables and efficiency gains can begin to curb coal growth. Coal, however, still underpins system stability. In India, first-half demand also dipped (–2.1% y/y in the power sector), yet the IEA projects a 1.3% annual increase for 2025. By contrast, the United States is an outlier among advanced economies. Coal demand rose 12% in H1 2025, and full-year growth is projected at 7% (to ~400 Mt), driven by robust electricity demand and elevated natural gas prices. In the European Union, coal use increased in the power sector during the first half of 2025, reflecting weaker hydro and wind output as well as higher gas prices.
Looking ahead, the IEA expects global demand in 2026 to fall marginally below 2024 levels, signaling the beginning of a potential downward phase. However, supply remains abundant: coal production is projected to exceed 9.2 billion tons in 2025, led by China and India, with incremental U.S. growth offsetting Indonesia’s decline. This supply expansion, in the context of flat demand, could exert downward pressure on prices and trade flows. Global coal trade is forecast to contract in 2025, the first decline since the COVID-19 shock of 2020, with another drop expected in 2026. If confirmed, this would mark the first consecutive two-year decline in seaborne coal trade in the 21st century, a development that could reshape freight markets and alter vessel employment patterns. Indonesia: Export Giant Under PressureIndonesia, the world’s largest exporter of thermal coal, has sharply expanded output over the past two decades, from about 557 million tons in 2018 to about 775 million tons in 2023, according to the Ministry of Energy & Mineral Resources. In 2024, production rose further to around 836 million tons. China and India remain Indonesia’s two biggest markets. Chinese buyers have openly resisted the government’s HBA benchmark pricing, while India has continued importing large volumes, albeit with periodic shifts in buying patterns. In March 2025, the government required that all coal transactions use its benchmark price (Harga Batubara Acuan, HBA) as a minimum, updated twice a month. The rule faced resistance from exporters and buyers, particularly in China, and in late August 2025, the government rescinded the requirement. Producers are no longer obliged to sell at benchmark levels, but taxes, royalties, and levies continue to be calculated on the HBA, leaving miners exposed to the spread between official valuations and actual market prices.
How we can help:
Thank you for your time. Regards, James Littlejohn Co-Founder Info@maritimedata.ai +44 (0)208 050 9806 You might be receiving this email because we believe that the content of our newsletter may be of interest to you based on your profession. However, if we have made an incorrect assumption, we apologise for any inconvenience caused. If you do not wish to receive future publications, please follow the instructions below to unsubscribe. |
.png)
Maritime Data Newsletter
A dedicated source of market insights and product developments from the largest network of specialised providers of maritime data and analytics.
Maritimedata.ai is a single source of access to 200+ data services. 200+ Products 60+ Maritime Intelligence Providers 30+ Years of Experience Explore our catalogue Insights 📈 Oil & Gas 🛢️ Russian Diesel Tanker Sails for Cuba as U.S. Order Blocks Oil Imports (Link) Does The Buy And Hold Strategy Still Work? (Link) Alaska Crude Diverts to Asian Markets (Link) Dry 🚢 A Market Increasingly Driven by Minerals Rather Than Energy (Link) Agricultural Freight Overview (Link) Other 🌎 Can Project Vault...
Maritimedata.ai is a single source of access to 200+ data services. 200+ Products 60+ Maritime Intelligence Providers 30+ Years of Experience Explore our catalogue Insights 📈 Oil & Gas 🛢️ Reassessing Russian Supply (Link) Mainstream oil supplies return to normalcy as surplus falls (Link) Moscow, we have a problem (Link) Dry 🚢 Bauxite offers real positivity for capesizes (Link) Agricultural Freight Overview (Link) Copper Insights: The Supply-Demand Disconnect (Link) Other 🌎 How accurate were...
Maritimedata.ai is a single source of access to 200+ data services. 200+ Products 60+ Maritime Intelligence Providers 30+ Years of Experience Explore our catalogue Insights 📈 Oil & Gas 🛢️ Clean Barrels (Link) A Fools Game? (Link) India crude imports set to remain elevated in January (Link) Dry 🚢 Iron Ore prices declined for a fifth consecutive session (Link) Agricultural Freight Overview (Link) Indonesia Cuts Coal Production Quotas (Link) Other 🌎 Takeaways from the 2026 U.S. National Defense...