A dedicated source of market insights and product developments from the largest network of specialised providers of maritime data and analytics.
Ageing VLCCs are an unlikely source of support to market 📅 The End of an era? 🇺🇸🛢️ Soybean flows are changing, but who reaps the rewards? 📈
|
Maritimedata.ai is a single point of access to 200+ data services We integrate the best maritime data sources into custom data pipelines so you can focus on decisions, not discovery. 200+ Products 55+ Maritime Intelligence Providers 30+ Years of Experience
Insights 📈Oil & Gas 🛢️
Dry 🚢
Other 🌎
Energy & Freight Insights Live: Nor-Shipping 2025
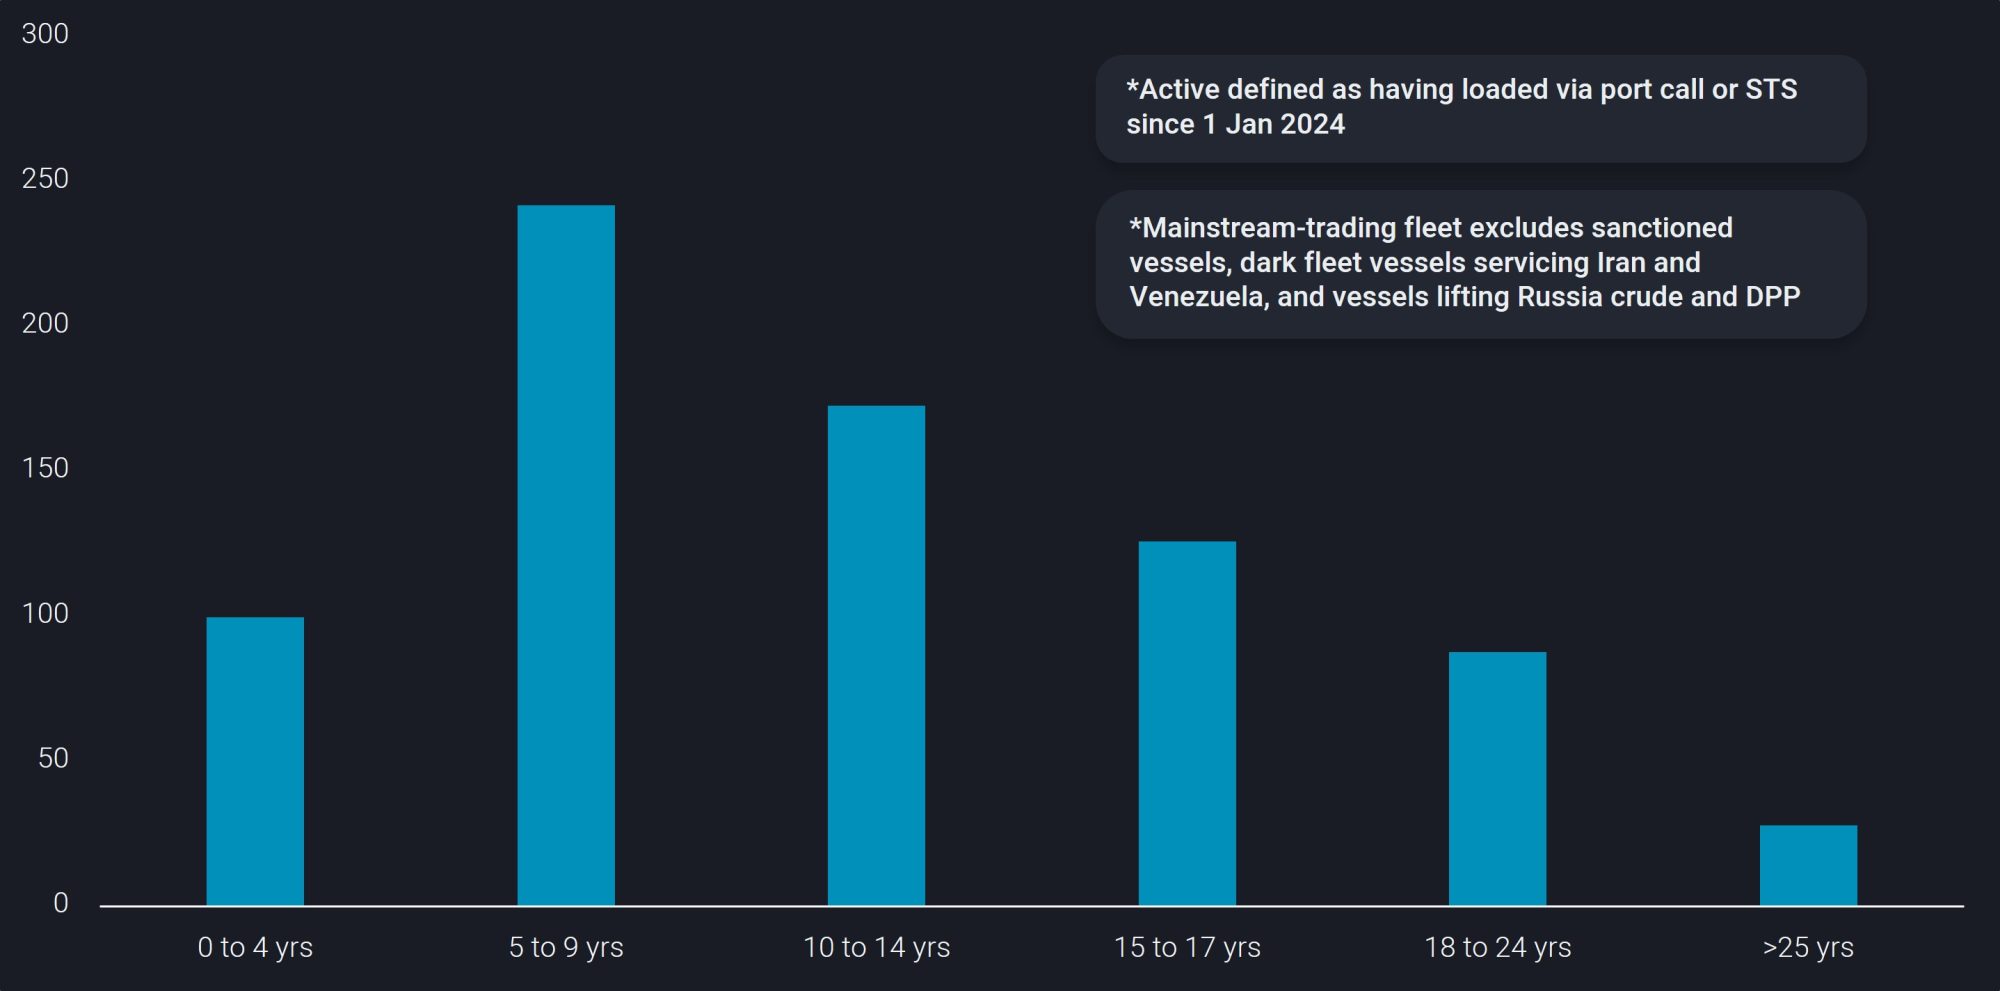
Ageing VLCCs are an unlikely source of support to market for now, but could be squeezed out in the near future - VortexaThe utilisation of ageing VLCCs is supportive of crude freight for now, but they will soon be squeezed out of the mainstream market into scrapping or servicing opaque flows 16% of the global mainstream-trading VLCC fleet is aged 18 years and above, and the utilisation of ageing vessels in the mainstream market has been steadily rising. This tonnage has been crucial in servicing crude flows, particularly in the Pacific Basin. With more new-builds scheduled for deliveries and pick-up in scrapping activities over the next few years, these aged VLCCs would be main candidates for scrapping, or new-joiners to the sanctioned trade if all sanctions regimes remain status-quo. 114 VLCCs aged 18 and above continue to be active* in mainstream trade**
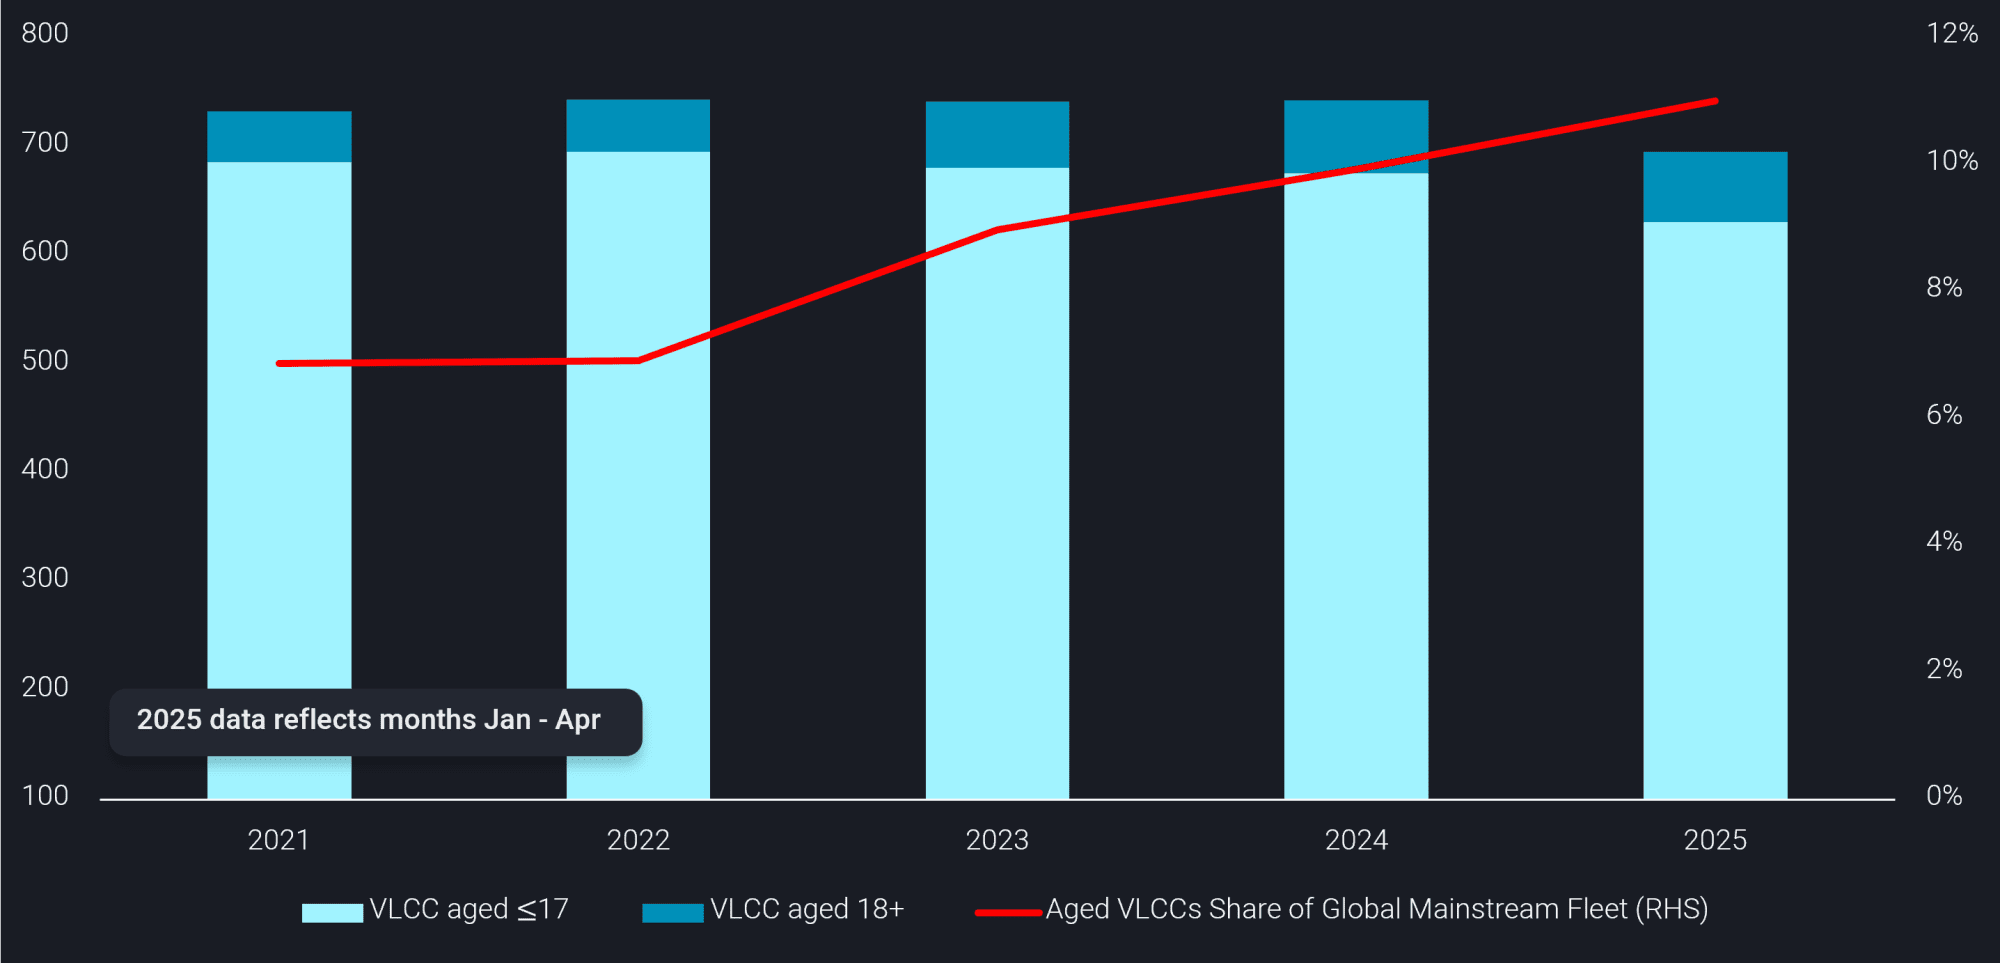
The operational performance of ageing VLCCs (18+) is usually inferior to younger vessels, which is one of the key reasons why major industry players maintain chartering policies that favour younger vessels. For instance, older vessels sail at lower average speeds of about 11%, compared to younger VLCCs aged <15 years leading to higher turnaround times, hence limiting vessel availability. In addition, ageing vessels typically require more frequent maintenance, including drydocking every 2.5 years beyond age 15 (Tankers International). Younger vessels could therefore benefit from the periods of shrinkage in effective vessel availability. Utilisation of ageing vessels in mainstream* markets is continuously rising
However, the employability of ageing VLCCs have risen in recent years as shipowners of older vessels tend to offer into cargoes at discounted levels. 10% of the global active VLCC fleet last year comprised vessels aged over 18. Low VLCC deliveries in 2023 and 2024 (Braemar), combined with the growing prevalence of a multi-tiered fleet structure, had strengthened the appeal for vessels to join the opaque trade (Russia, Iran, Venezuela). This diversion has helped ageing vessels maintain and grow their share in both the mainstream and opaque markets. Additionally, this is a reflection of the willingness of industry participants to hire older vessels in the face of constrained vessel supply.
The End of An Era? - Poten & PartnersU.S. crude oil exports have reached a plateau Ever since President Obama lifted the 41-year-old U.S. crude oil export ban in December 2015, U.S. crude oil has played an increasingly important role in the tanker market. Despite logistical challenges due to the relatively shallow draft of U.S. Gulf ports, American producers have become one of the largest seaborne crude oil exporters. A mix of medium and long-haul clients in Europe, Asia and Africa (Dangote) offers employment opportunities for the whole range of crude tankers, from VLCCs down to Aframaxes, the latter also being used for reverse lightering operations in the area. However, after exports increased from a few hundred thousand barrels per day in 2016/2017 to an average of 4.0 Mb/d in 2023, growth has leveled off. In 2024, exports were 160,000 b/d lower than in 2023 and so far in 2025, we have seen a further 90,000 b/d decline. In the past, U.S. oil production, especially from the shale patch has proven to be very resilient, but it appears that the period of rapid production and export growth is in the rearview mirror. What can be expected from the U.S. in the coming years and how will that impact the tanker market? U.S. crude oil exports are driven by a number of factors. The first, most obvious, is domestic production, in particular shale oil production. The United States still produces significant volumes of “conventional” crude oil from places like Alaksa (412 Kb/d in 2024), California (285 Kb/d) and the Gulf of Mexico offshore (1.8 Mb/d). However, the vast majority of U.S. output comes from shale deposits in North Dakota, Oklahoma, New Mexico and Texas. In April 2025, U.S. tight oil production totaled 9.15 Mb/d, representing almost 70% of total U.S. output. U.S. tight oil production is currently under pressure. Oil prices have come down as heightened global economic uncertainty resulted in lower demand growth. Recent OPEC+ production increases have added to the downward pressure on crude oil prices. U.S. shale plays are classic examples of short-cycle oil. They can be brought online rapidly, but require constant reinvestment to maintain production levels, which makes them very sensitive to price movements. WTI prices are currently in the $61-$62/barrel range, which is enough to maintain production. While breakeven prices vary considerably by company and geography, current consensus seems to be that if prices fall to the low-mid $50/barrel range, shale producers will be challenged, while prices at $70/barrel or more will encourage more production. If prices stay at current levels, U.S. tight oil production has probably peaked. The EIA, in their latest short term energy outlook, expects only a small pickup in output later this year 2025, before U.S. crude oil production starts to decline in 2026 (Chart 1). A lot of this will depend on the development of oil prices though.
Soybean flows are changing, but who reaps the rewards? - Signal OceanOn the whole, soybean export volumes in 2025 do not look dissimilar to those of recent years. As a result, it would be easy to assume that nothing in the market has changed. However, a deeper look into the market shows some compelling changes in trade flows. The major change has come from lower exports of soybean products from the U.S., which first started to decline during the 2018-19 marketing year. Figures from the Food and Water Watch (FWW) show that farm bankruptcies surged 24% that year, as Trump’s first-term trade policies led the U.S.’s largest soybean export market, China, to hit back with a 25% tariff on soybeans. This tariff rose further in 2019 to 35% as the trade war intensified, before some allowances were made on quantities of soybeans. Since Donald Trump’s re-inauguration in January 2025, tariffs have been used broadly by the U.S. government, with retaliatory tariffs issued back. As a result, all imports from the U.S. into China received a 125% tariff at the beginning of April. The spike in soybean product exports in March can be explained by buyers taking orders of U.S. soybeans before any retaliation was taken by the Chinese government. Recent trade discussions during a meeting in Geneva in May have seen the tariffs on Chinese products imported into the U.S. fall to 30% from 145%, and China has cut tariffs on U.S. goods to 10%. On the surface, this should be good for U.S. exports and Panamax demand from U.S. ports, but currently, this softening on tariffs is only in effect for 90 days. China changes import strategy for soybean productsSince the height of the trade war, China has been actively looking to reduce its reliance on imports from the U.S. One way they have achieved this is by looking for different sources for agricultural products such as soybeans. This can be seen by the proportional drop in the quantity of soybean products China imports from the U.S. Back in 2022, over 31% of Chinese soybean product imports came from the U.S.; this fell to just under 23% in 2024. China has made up for the fall in U.S. soybean products mostly by importing more from Brazil. The South American country has seen its share of soybean product imports to China rise from 54% in 2022 to over 64% in 2024. Adding to the pressure on American soybean farmers is an expectation that the 2024-2025 season will be a bumper year for the crop in Brazil, Argentina, and the rest of South America. The La Nina weather pattern did affect some soybean production on the continent, but on the whole, production is expected to be much larger than the previous year, putting pressure on soybean prices and likely increasing the purchasing power of Chinese importers. Furthermore, the 2025-2026 season will have no La Nina effects, so yields will continue to be strong in South America, again adding pressure on American soybean exports.
How we can help:
Thank you for your time. Regards, James Littlejohn Co-Founder Info@maritimedata.ai You might be receiving this email because we believe that the content of our newsletter may be of interest to you based on your profession. However, if we have made an incorrect assumption, we apologise for any inconvenience caused. If you do not wish to receive future publications, please follow the instructions below to unsubscribe. |

Maritime Data Newsletter
A dedicated source of market insights and product developments from the largest network of specialised providers of maritime data and analytics.
Maritimedata.ai is a single source of access to 200+ data services. 200+ Products 60+ Maritime Intelligence Providers 30+ Years of Experience Explore our catalogue Insights 📈 Oil & Gas 🛢️ Crisis In Caracas (Link) Sanctions and Tariffs Test Russia’s Crude Trade (Link) Strong gasoline margins supported by supply-side outages (Link) Dry 🚢 Global Coal Trade is Finally Faltering (Link) Why coking coal prices are rising? (Link) Brazilian exports increased 7% month-over-month (Link) Other 🌎 Global...
Maritimedata.ai is a single source of access to 200+ data services. 200+ Products 60+ Maritime Intelligence Providers 30+ Years of Experience Explore our catalogue Insights 📈 Oil & Gas 🛢️ Ready for a Rebound - VLCCs are well positioned to lead a tanker market upturn (Link) The Beginning of the End (Take 2) (Link) The Aging Global Tanker Fleet: Causes, Market Impact, and What Comes Next (Link) Dry 🚢 Iron ore, coal, and grains: Limited growth as China slows (Link) Dry Bulk Freight Recap (Link)...
Maritimedata.ai is a single source of access to 200+ data services. 200+ Products 60+ Maritime Intelligence Providers 30+ Years of Experience Explore our catalogue Insights 📈 Oil & Gas 🛢️ Exploring correlation in CPP freight and arb indicators (Link) OPEC Remains Opaque (Link) What’s Steering Aframax Demand? (Link) Dry 🚢 Decrease in mining activity at major mines in Australia like Goonyella, Saraji and Moranbah North. (Link - email required) Agricultural Commodities Update (Link) Minor Bulks...