A dedicated source of market insights and product developments from the largest network of specialised providers of maritime data and analytics.
‘Drill, Baby, Drill’ With Low Oil Prices? 🛢️ Record stockpile of sanctioned crude builds in Shandong amid supply disruption fears 📈 Maritime Risk Assessment for Portugal, Sweden and the Baltic Sea with an emphasis on shadow fleets 🔦
|
Maritimedata.ai is a digital broker of data and analytics solutions for the maritime ecosystem. Source, Evaluate and Purchase maritime data and analytics from the largest network of specialised providers in the world. 200+ Products 50+ Maritime Intelligence Providers 30+ Years of Experience Insights 📈Oil & Gas 🛢️
Dry 🚢
Other 🌎
Explore, test, and feedback on maritime data solutions before they hit the market.We're delighted to be launching a number of beta tests for new-to-market data services over the next few months, and we'd like to offer you the opportunity to take part. Upcoming Opportunities 2025
How to get involved?You can register your interest for future beta tests below.
‘Drill, Baby, Drill’ With Low Oil Prices? - Poten & PartnersHow will U.S. goal of energy dominance deal with low oil prices? U.S. crude oil production has grown rapidly over the last decade, even though there were some setbacks along the way. During the COVID driven demand and oil price crash, which was further exacerbated by Saudi Arabian production increases, U.S. production dropped from around 20.5 million barrels per day (Mb/d) in January 2020 to 16.2 Mb/d by April 2020. While the current situation is very different from 2020, the combination of growing uncertainty about short term oil demand, due to economic uncertainty and the production increases announced by OPEC+ have caused oil prices to decline by more than $12 over the last week. This opinion will take a look at what this might mean for U.S. crude oil production and exports. President Trump came into office with a promise to increase energy production by loosening regulations that slow production growth and by other measures, such as providing easier access to Federal lands for oil and gas production. He is trying to implement these policies through executive orders, some of which may be challenged in courts. However, in contrast to some other oil producing countries, the U.S. government does not drill wells and produce oil and gas. In the U.S., private companies are the ones performing such work and they will only do so if these activities are profitable. Prior to the COVID price crash in 2020, many of these companies were focused on maximizing production as investors rewarded growth over profitability. However, they learned a lesson during the crash as many of the producers went bankrupt and assets were sold to competitors. So, during the recovery after 2020, the focus switched to profitability and shareholder returns. Cash flow was returned to investors in the form of dividends and share buybacks, rather than reinvested into maximizing production growth. The oil price decline over the last week was caused by the fallout of the tariff announcement by President Trump that triggered panic in the financial markets and heightened fears of a recession in the U.S. and other countries. This tariff announcement was followed by a statement from OPEC+ that they would increase oil production by 411 Kb/d in May, about three times the anticipated increase. On Wednesday, President Trump announced that he would pause the implementation of the ‘Reciprocal tariffs’ by 90 days on most countries, which led to a partial recovery of oil prices, but on Thursday WTI had fallen back to $60/bbl. Overall, the risk of a recession remains elevated due to increased policy uncertainty, which makes it hard for companies to decide on investment and hiring strategies. Under these circumstances, many companies decide to hold onto their cash and wait.
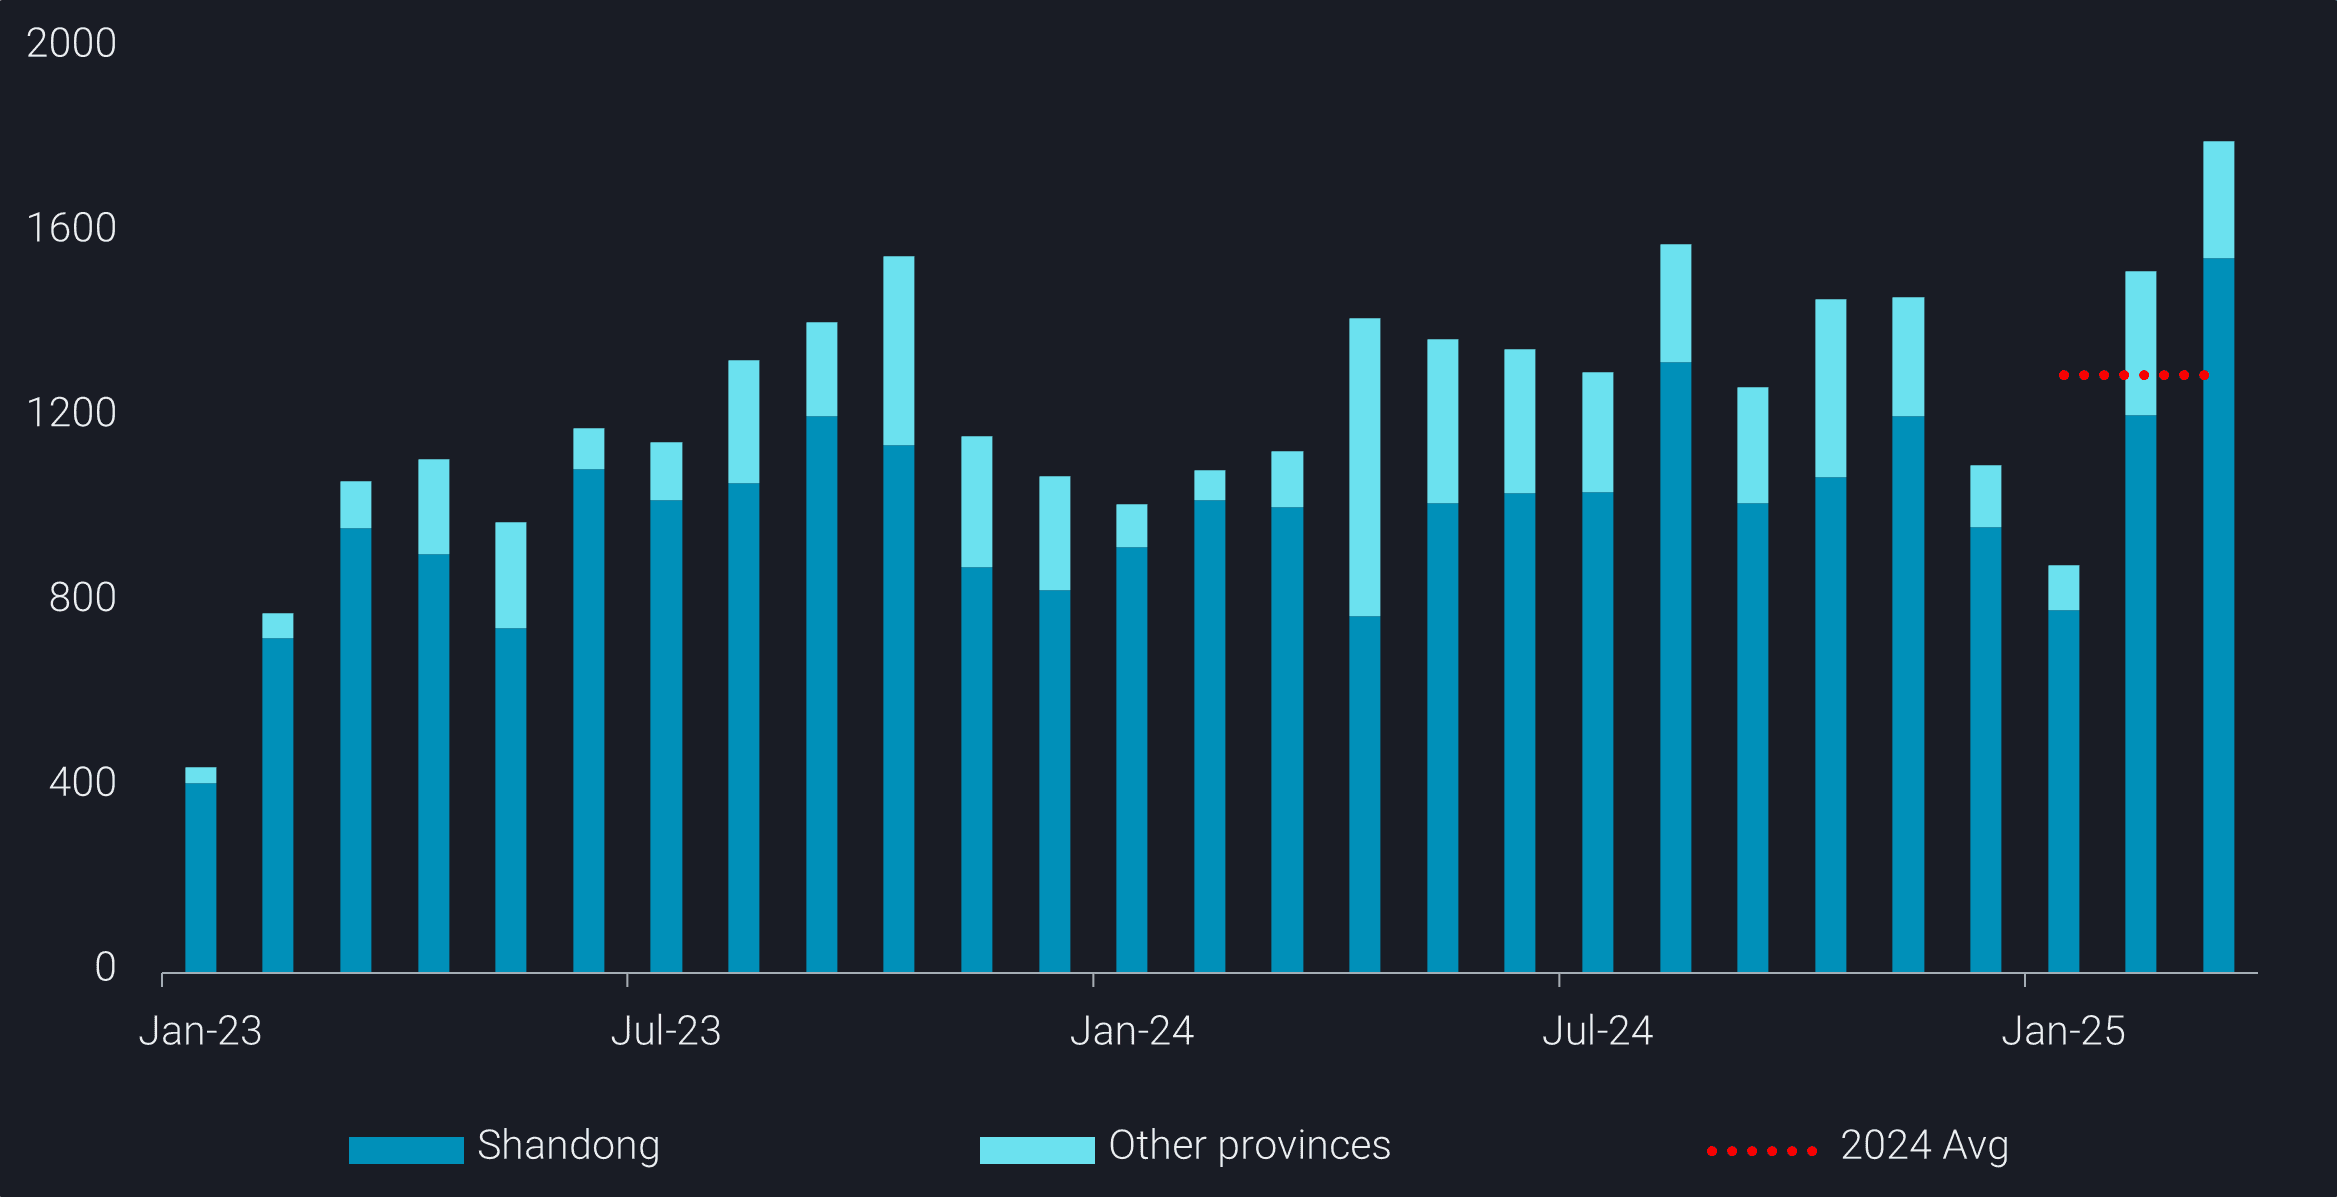
Record stockpile of sanctioned crude builds in Shandong amid supply disruption fears - VortexaChina’s seaborne crude imports rebounded to 10.6mbd in March—the highest since October 2023—driven largely by record Iranian crude arrivals into the Shandong region. The latest OFAC sanctions targeting additional Iran-linked tankers have deepened concerns about potential disruptions to Iranian crude flows, prompting refiners to accelerate stockpiling of this critical feedstock. Iranian crude imports into China surged to a record 1.8mbd in March, with Shandong alone absorbing over 1.5mbd and marking a nearly 50% jump from the 2024 average.
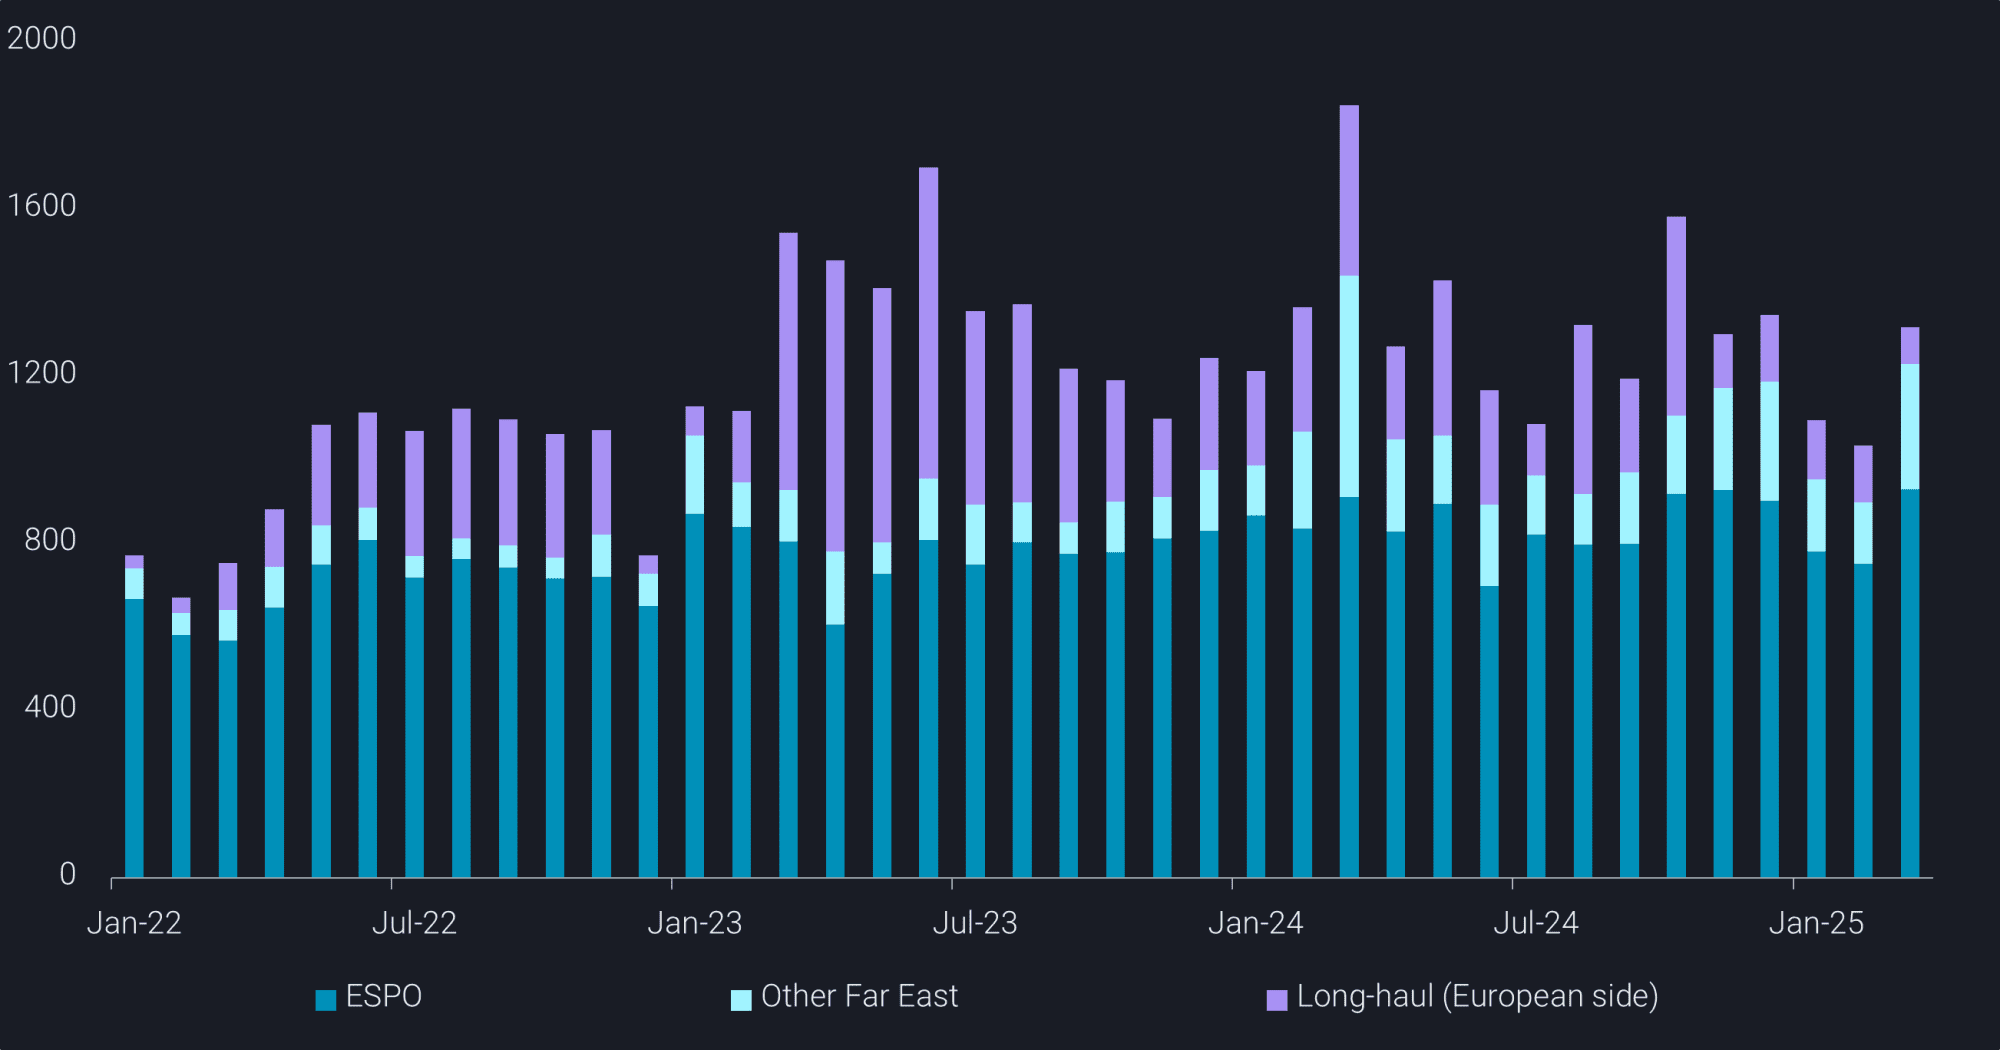
Shandong’s onshore crude inventories rose by over 20mb during March—an increase that closely mirrors the surge in Iranian oil arrivals and represents the fastest monthly stock build on record. The current high inventory levels have strengthened Shandong teapots’ bargaining power, allowing them to slow down on stockpiling and demand steeper discounts for upcoming deliveries. Despite likely slower inbound flows in April, demand for discounted feedstock remains firm, buoyed by improved domestic refining margins in April as oil benchmark prices collapsed. Meanwhile, Iranian crude floating storage in the South China Sea held steady at around 30mb at the end of March, down slightly from 33mb at the start of the month. The near 7-year-record export pace in March—just shy of 1.8mbd—suggests Iran moved aggressively to send barrels eastward ahead of any further supply hiccups. Russian Arctic crude on sanctioned tankers as well eyes ShandongChina’s seaborne imports of Russian crude also rebounded to 1.3mbd in March, in line with the 2024 average. This recovery was led by Far East grades, which surged to a 12-month high, as stranded Sokol and Sakhalin Blend cargoes from January and February found buyers at discounted rates. These gains helped offset declining imports of long-haul Urals and Arctic crude, constrained by a tight pool of non-sanctioned tankers after the Jan-10 sanctions.
Now, Russian Arctic crude loaded on sanctioned tankers post-January 10 is beginning to arrive in the South China Sea, targeting orders from teapot refiners who had largely reduced long-haul Russian barrel purchases since 2024. Notably, a non-sanctioned VLCC, previously active in Iranian STS deliveries, is now carrying Russian Arctic crude—loaded via two STS transfers—and is currently signalling Shandong. This suggests Russian barrels were offered at even deeper discounts than Iranian crude, appealing to price-sensitive teapots.
Maritime Risk Assessment for Portugal, Sweden and the Baltic Sea with an emphasis on shadow fleets - Sabine Knapp & Erasmus UniversityWhile safety qualities of vessels in the maritime industry have improved over time, recent geopolitical developments and tensions influence maritime trade flows and the associated risk exposure of the global fleet. This comprehensive study quantifies risk exposure in the Portuguese EEZ, the Swedish EEZ and the Baltic Area with an emphasis on pollution risk exposure from tankers and the emerging shadow fleet. Risk exposure is expressed as the monetary value at risk (MVR), a proxy of potential incident costs calculated at ship level. We construct a shadow fleet watchlist comprising of designated vessels and supplemented by additions based on a prediction model. We construct a shadow fleet watchlist comprising of designated vessels and supplemented by additions based on a prediction model. The study is based on comprehensive datasets using global ship particular data, incident data and global AIS data. The resulting analysis is based on over 45.2 million estimates of 146,103 unique ships from January 2021 to December 2024. Risk exposure is highly seasonal for cruise and passenger ships that are an important risk exposure component for the Portuguese EEZ and the Baltic Area besides tankers. At the global level, pollution risk exposure increased by 3% for tankers and 3.7% for oil tankers from 2023 to 2024 while in the areas of interest, the increase is estimated to be higher (over 40% for the Baltic Region, over 100% for the Gulf of Finland and over 20% for the Portuguese EEZ). Vessels on designated lists account for 7.4% of global pollution risk compared to 32% for the Gulf of Finland or 54% if the total shadow fleet is considered. We project a monthly increase of pollution risk exposure for tankers of 2.7% for the Gulf of Finland up to December 2027. At the regional level and as at December 2024, risk exposure (MVR-TLVSS) is estimated to be USD 542 million for Portugal, USD 216 million for Sweden and USD 841 for the Total Baltic Area. A large portion of this is allocated to the Gulf of Finland (20%) albeit its small area. The largest average yearly increase is for the Portuguese Continent with 26%. The percentage to global total is highest with the Total Baltic Area at 1.9%. Results showed an increase of total global nautical miles travelled from the active fleet from 2.4 billion to 2.7 billion or an average increase of 3% from 2022 to 2024. Overall, risk exposure has increased at the global level by an average yearly increase of 5.4% from 2022 to 2024 (monthly 2.3%) while higher increases can be seen for individual regions.
How we can help:
Thank you for your time. Regards, James Littlejohn Co-Founder Info@maritimedata.ai You might be receiving this email because we believe that the content of our newsletter may be of interest to you based on your profession. However, if we have made an incorrect assumption, we apologise for any inconvenience caused. If you do not wish to receive future publications, please follow the instructions below to unsubscribe. |
Maritime Data Newsletter
A dedicated source of market insights and product developments from the largest network of specialised providers of maritime data and analytics.
Maritimedata.ai is a single source of access to 200+ data services. 200+ Products 60+ Maritime Intelligence Providers 30+ Years of Experience Explore our catalogue Insights 📈 Oil & Gas 🛢️ Upstream Under Attack (Link) Keeping Up With The Joneses (Act)(Link) The Strait of Hormuz remains constrained but operational under a clearly selective transit framework (Link) 'Zombie ship' uses fake ID to shuttle Iranian oil through Strait of Hormuz (Link) Dry 🚢 U.S. Overtakes Brazil in Corn Exports to...
Maritimedata.ai is a single source of access to 200+ data services. 200+ Products 60+ Maritime Intelligence Providers 30+ Years of Experience Explore our catalogue Insights 📈 Oil & Gas 🛢️ Transit activity through the Strait of Hormuz remained heavily suppressed (Link) Middle East Mayhem (Link) Strait of Hormuz Disruption - Scenario Analysis (Link) Dry 🚢 Dry Bulk Impact of Trump's Spain Threat (Link) Agricultural Freight Overview (Link) Other 🌎 The Supreme Court’s IEEPA tariff decision: What...
Maritimedata.ai is a single source of access to 200+ data services. 200+ Products 60+ Maritime Intelligence Providers 30+ Years of Experience Explore our catalogue Insights 📈 Oil & Gas 🛢️ Russian Diesel Tanker Sails for Cuba as U.S. Order Blocks Oil Imports (Link) Does The Buy And Hold Strategy Still Work? (Link) Alaska Crude Diverts to Asian Markets (Link) Dry 🚢 A Market Increasingly Driven by Minerals Rather Than Energy (Link) Agricultural Freight Overview (Link) Other 🌎 Can Project Vault...