A dedicated source of market insights and product developments from the largest network of specialised providers of maritime data and analytics.
Global Port Congestion: H1 2024 in Review 🛳️ Is a supply-side shift underway for Atlantic Basin MRs? 🛢️ Conflict Brewing In The Middle East 🚢
|
Maritimedata.ai is a digital broker that provides data and analytics solutions for the maritime ecosystem. Source, evaluate and purchase maritime data and analytics from the largest network of specialised providers in the world. Explore global trade through the specialised lens of leading maritime intelligence providers. The Maritime Data Newsletter delivers timely updates and deep market insights, curated directly from our expansive network of experts. Insights 📈Oil 🛢️
Dry 🚢
Other 🌍
Global Port Congestion: H1 2024 in Review - BeaconNorth American Port Congestion: Struggles in Charleston, Stability on the West CoastOur port congestion index reveals the Port of Charleston experienced a staggering 132.36% increase in congestion, with average combined anchor and berth times jumping from 1.39 days across Q1 to 3.23 days in Q2. While Charleston struggled, other North American ports generally maintained stable congestion levels. Vancouver, despite remaining among the top five most congested ports globally, managed to reduce average congestion times by 1.44 days compared to Q1. Los Angeles also held steady, demonstrating resilience amidst high demand. This trend is encouraging for the persistently congested North American West Coast. Elsewhere in North America, Houston and Oakland reduced congestion times by 1.5 and 1.0 days, respectively. Asian Port Congestion: A Mixed BagIn Southeast Asia, 64% of analysed ports saw rising congestion. Manila reported the most significant increase, adding nearly 20 hours to average anchor and berth times. Chittagong (Bangladesh), Port Kelang (Malaysia) and Singapore also reported large increases in congestion levels. Conversely, East Asia has shown remarkable resilience. Only four of 26 analyzed ports reported increased average congestion in Q2. Ningbo-Zhoushan, however, saw congestion rise by 17.7% despite a strong month-on-month improvement in June. Ports Reporting the Largest Congestion Increases (Q2 vs. Q1) Port
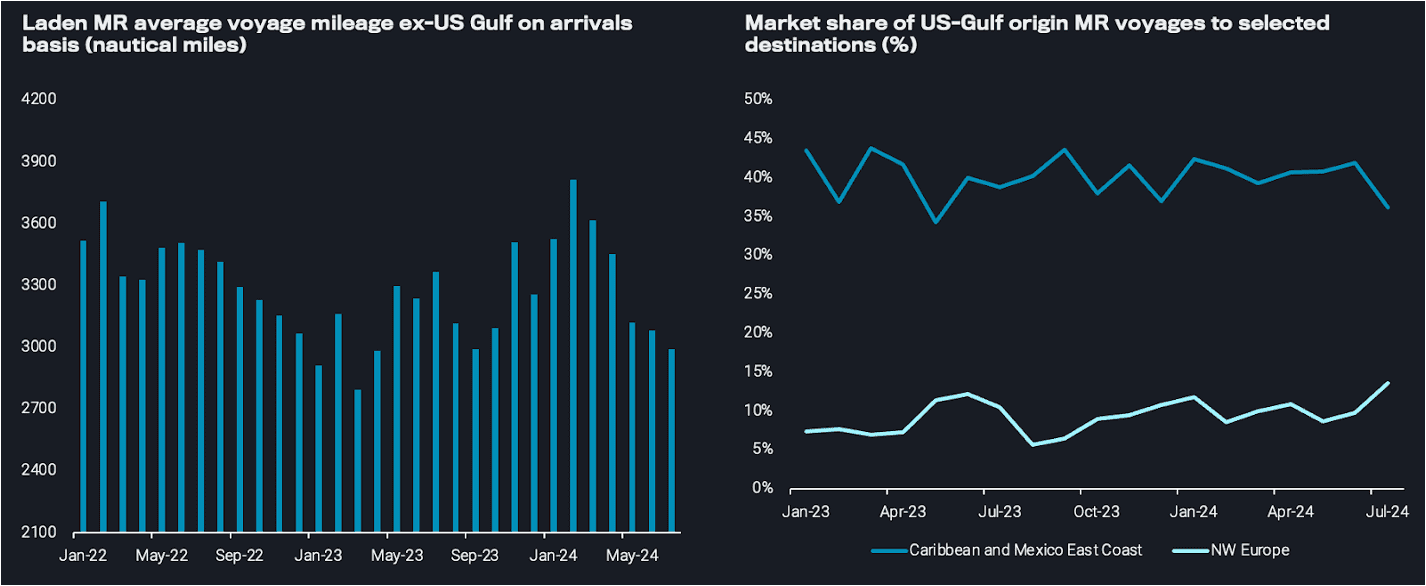
Is a supply-side shift underway for Atlantic Basin MRs? - VortexaWeaker CPP demand in the US domestic market has pushed supplies to the seaborne export market, propelling June exports well above y-o-y levels and remaining robust in July after minimal disruption to PADD 3 refineries from Hurricane Beryl. US Gulf refiners are incentivised to send exports short-haul due to the lower freight cost, and the Caribbean and Mexico East Coast have absorbed these supplies. This has coincided with a string of refinery issues in Mexico following high refinery runs in the run-up to the election. Thus, the return of Mexico’s road fuel demand has been a boon for PADD 3 refiners. For MRs operating in the US Gulf, high CPP exports have translated to high tanker demand. However, the short-haul nature of these voyages to Mexico East Coast and the Caribbean is failing to clear available tonnage in the region. This has caused much volatility in the region’s freight rates, with rates oscillating drastically between big peaks and troughs due to the short voyage duration. Over the last two months, the supply side has outmuscled the demand impetus, and the freight rates trajectory has been driven by rapid changes in prompt vessel supply. This has also coincided with gradually increasing vessel supply in the US Gulf over the past month as vessels were enticed by the high earnings to reposition from elsewhere. As a result of this high short-haul employment, average voyage mileage for all MR voyages originating in the US Gulf has been significantly lower over the last few months and continues to decline. On average, voyage mileage May-July is 12% less than in April. However, this could be changing, as a softly but persistently open arbitrage for diesel US Gulf-to-Europe (Argus) has increased transatlantic utilisation over the past two weeks. An increase in long-haul utilisation will also alleviate some of the excess tonnage in the US Gulf, which will likely soften the volatility in the freight rates and increase the turnaround time between peaks and troughs in vessel demand.
Additionally, one factor which could ease the tonnage imbalance in the US Gulf is the increased likelihood that the vessels carrying cargo to NW Europe will stay and trade in Europe. Prompt vessel supply in NW Europe thinned during July, and freight rates increased around 35% in the last month (TC2). Also, the number of ballast vessels departing for NW Europe has decreased over the past month, pointing to a likely tightening supply and therefore higher earnings. Higher rates in Europe due to the scarcity of tonnage could stem the tide of vessels repositioning to the US Gulf to take advantage of higher rates.
Conflict Brewing In The Middle East - Poten & PartnersWhat could be the impact on the tanker market? Ever since October 2023, when the Hamas attack on Israel ignited a major conflict in that region, tensions in the Middle East have been high. The recent killings of senior Hamas and Hezbollah officials have further escalated the situation. In the past, increasing tensions in the Middle East would immediately translate into a spike in oil prices, usually followed by higher tanker rates. The reaction of the oil and tanker markets has been fairly muted so far. Is that a quiet before the storm or have the circumstances in the region changed? While nobody knows what will happen next in the Middle East, we can discuss some of the elements that are different this time, while keeping in mind that certain conditions that could lead to an escalation are still very much in place. There are several reasons why conflicts in the Middle East always trigger thoughts of spikes in oil prices and tanker rates. Firstly, the region still produces and exports a very significant percentage of global oil. In 2023, around 30% of global crude oil production came from the Middle East. The vast majority of this oil originates from five OPEC countries: Saudi Arabia, Iran, Iraq, Kuwait and the United Arab Emirates. The other reason why the world – and the shipping industry in particular – pays close attention to the Middle East, is that three of the major world oil transit “chokepoints” are in the region. In 2023, 20.9 Mb/d of crude oil and products passed through the Strait of Hormuz, 8.8 Mb/d through the Suez Canal / Sumed pipeline and 8.6 Mb/d through the Bab el-Mandeb Strait. History shows a long list of events in the Middle East that had a major impact on oil and tanker markets. Some of the key postWorld-War-II oil shocks include the Suez Crisis of 1956-57, the OPEC oil embargo of 1973-1974, the Iranian revolution of 19781979, the Iran-Iraq War initiated in 1980 and the first Persian Gulf War in 1990-91.
How we can help:
Thank you for your time. Best regards, James Littlejohn Co-Founder Info@maritimedata.ai You might be receiving this email because we believe that the content of our newsletter may be of interest to you based on your profession. However, if we have made an incorrect assumption, we apologise for any inconvenience caused. If you do not wish to receive future publications, please follow the instructions below to unsubscribe. |
Maritime Data Newsletter
A dedicated source of market insights and product developments from the largest network of specialised providers of maritime data and analytics.
Maritimedata.ai is a single source of access to 200+ data services. 200+ Products 60+ Maritime Intelligence Providers 30+ Years of Experience Explore our catalogue Insights 📈 Oil & Gas 🛢️ Upstream Under Attack (Link) Keeping Up With The Joneses (Act)(Link) The Strait of Hormuz remains constrained but operational under a clearly selective transit framework (Link) 'Zombie ship' uses fake ID to shuttle Iranian oil through Strait of Hormuz (Link) Dry 🚢 U.S. Overtakes Brazil in Corn Exports to...
Maritimedata.ai is a single source of access to 200+ data services. 200+ Products 60+ Maritime Intelligence Providers 30+ Years of Experience Explore our catalogue Insights 📈 Oil & Gas 🛢️ Transit activity through the Strait of Hormuz remained heavily suppressed (Link) Middle East Mayhem (Link) Strait of Hormuz Disruption - Scenario Analysis (Link) Dry 🚢 Dry Bulk Impact of Trump's Spain Threat (Link) Agricultural Freight Overview (Link) Other 🌎 The Supreme Court’s IEEPA tariff decision: What...
Maritimedata.ai is a single source of access to 200+ data services. 200+ Products 60+ Maritime Intelligence Providers 30+ Years of Experience Explore our catalogue Insights 📈 Oil & Gas 🛢️ Russian Diesel Tanker Sails for Cuba as U.S. Order Blocks Oil Imports (Link) Does The Buy And Hold Strategy Still Work? (Link) Alaska Crude Diverts to Asian Markets (Link) Dry 🚢 A Market Increasingly Driven by Minerals Rather Than Energy (Link) Agricultural Freight Overview (Link) Other 🌎 Can Project Vault...