A dedicated source of market insights and product developments from the largest network of specialised providers of maritime data and analytics.
The Strait of Hormuz 🇮🇷 - Stalled Recovery and Familiar Trade Patterns 🚢
|
Maritimedata.ai is a single source of access to 200+ data services. 200+ Products 60+ Maritime Intelligence Providers 30+ Years of Experience Insights 📈Oil & Gas 🛢️
Dry 🚢
Other 🌎We Tested Whether Physical Supply Shows Up in Price First - Introducing Projective Fuel Oil & Feedstock FlowsProjective Fuel Oil & Feedstock FlowsIn partnership with a leading fuel oil market intelligence provider, Projective Fuel Oil & Feedstock Flows is forward-looking cargo intelligence that projects physical cargo movements, inventories and trader behaviour weeks before barrels arrive. It provides forward visibility into the supply dynamics that ultimately shape regional balances and pricing, with up to ~60 days of forward discharge visibility and ~94% counterparty/trader coverage. Physical traders use it to understand competitor activity, inventory builds and arbitrage opportunities before they become visible to the wider market. Quantitative researchers, paper traders and financial institutions use the same intelligence to better understand the physical drivers behind futures pricing, spreads, cracks, time structures and regional dislocations. Conventional vessel tracking and reactive datasets simply can't provide this layer of insight. The question we set out to testDoes observable physical inventory pressure actually tell you where Singapore HSFO cracks go next? Does observable physical inventory pressure actually tell you where Singapore HSFO cracks go next? We ran the study using cargo-level fuel oil intelligence. The setup: three inputs combined into one weekly series — physical cargo intelligence (product, status, confidence, destination, timing), Singapore HSFO bunker prices, and Brent crude (to strip out broad crude moves). Aligned to weekly Monday dates across 2022–2025, roughly 200 weekly observations. The scale of testing: 22,572 valid model configurations, checked against 4.31 million underlying observation rows. This wasn't a single lucky correlation - the same relationship was tested across thousands of plausible model specifications. The headline finding-0.6155 is the strongest Spearman (rank) correlation observed, with a Pearson (linear) correlation of -0.5212 across 202 weekly observations. Strong for a physical commodity signal built from observable cargo data. Higher observable HSFO inventory pressure was consistently associated with weaker future Singapore HSFO crack levels and the relationship peaked at roughly two weeks forward, before fading. Physical pressure takes time to reach the screen. Persistence mattered too: four-to-six-week rolling and decayed inventory accumulation outperformed single-week readings by a wide margin, suggesting inventory pressure behaves like a slow-moving market state rather than a short-term trigger. What makes this more than a one-off number: across the top 100 model configurations, several design choices - high-confidence cargo, HSFO-only flows, prompt arrivals (0–4 weeks), future crack levels as the target - appeared in 100% of them. That clustering, across independent dimensions at once, is the core evidence the relationship is structural rather than a statistical outlier. Built for backtesting, not just monitoringThe underlying data now carries meaningfully deeper history than a snapshot service, with structured data available back to Jan 2022 depending on report and region - enough runway to properly backtest a signal like this one rather than just watch it forward. Get the full frameworkThe full Physical Fuel Oil Inventory Pressure Research Framework methodology, every factor tested, the winning configurations, and the limitations.
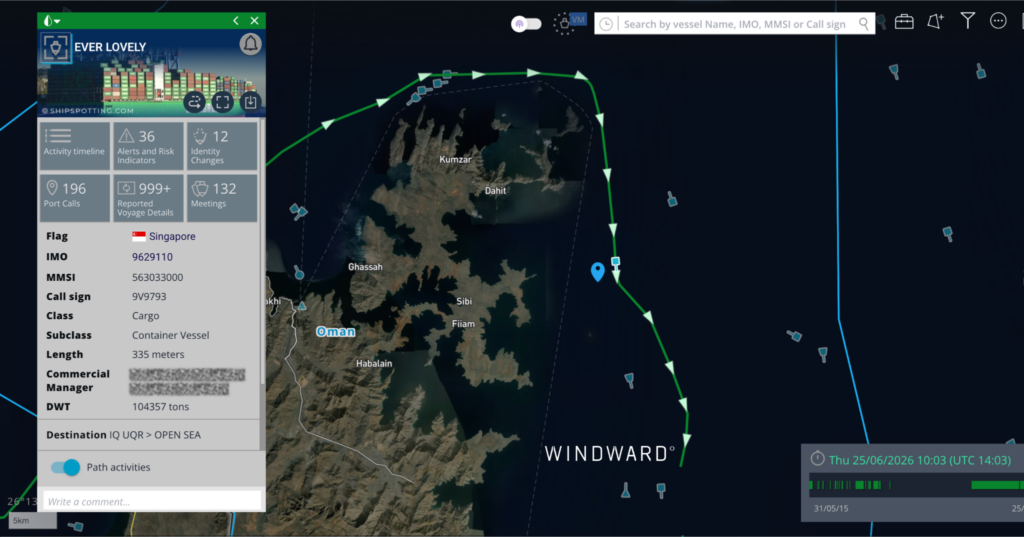
Hormuz’s Stalled Recovery: Two Strikes and Suspended Evacuation - WindwardThe Strait of Hormuz is technically open, but it is not functioning as commercial infrastructure. Two kinetic incidents in 72 hours, an IMO evacuation corridor suspended without a resumption date, and total daily transits averaging approximately 13, roughly 90% below pre-war levels, collectively describe a corridor that is open in name but operating well below the threshold of normal commercial activity. What has not collapsed is the U.S.-assisted southern corridor under Project Freedom, which has continued to function throughout the IMO suspension and is now sustaining the southern lane on its own, with a Saudi-flagged tanker confirmed transiting under active U.S. AWACS air cover on June 29. Iran’s posture is hardening rather than softening. The IRGC issued a formal statement on June 24 declaring any routing outside Iranian-designated lanes highly dangerous and prohibited. The June 25 EVER LOVELY attack followed in the southern corridor, and the June 27 UAV strike on a Panama-flagged VLCC carrying Qatari crude, KIKU, introduced a non-sanctioned, commercially neutral vessel into the targeting set. In parallel, two OFAC-sanctioned Iranian-linked tankers have been identified broadcasting fraudulent Norwegian flag registrations, a deliberate provocation in a corridor under active U.S. and European military scrutiny. Windward assesses that the Strait is now operating under competing pressures, with Iranian enforcement tightening on one side and U.S. military escort maintaining a corridor on the other, and that the gap between technical openness and functional commercial throughput continues to widen. Two Strikes in 72 HoursThe post-MoU operating environment has been tested by two kinetic incidents over a three-day window, the first targeting a small cargo vessel and the second a major VLCC carrying Gulf-produced crude. On June 25, the Singapore-flagged cargo vessel EVER LOVELY (IMO 9629110) was struck by a projectile approximately 7.5 nautical miles southeast of Dahit, Oman, in the southern corridor. UKMTO confirmed damage to the bridge with no casualties and no environmental impact.
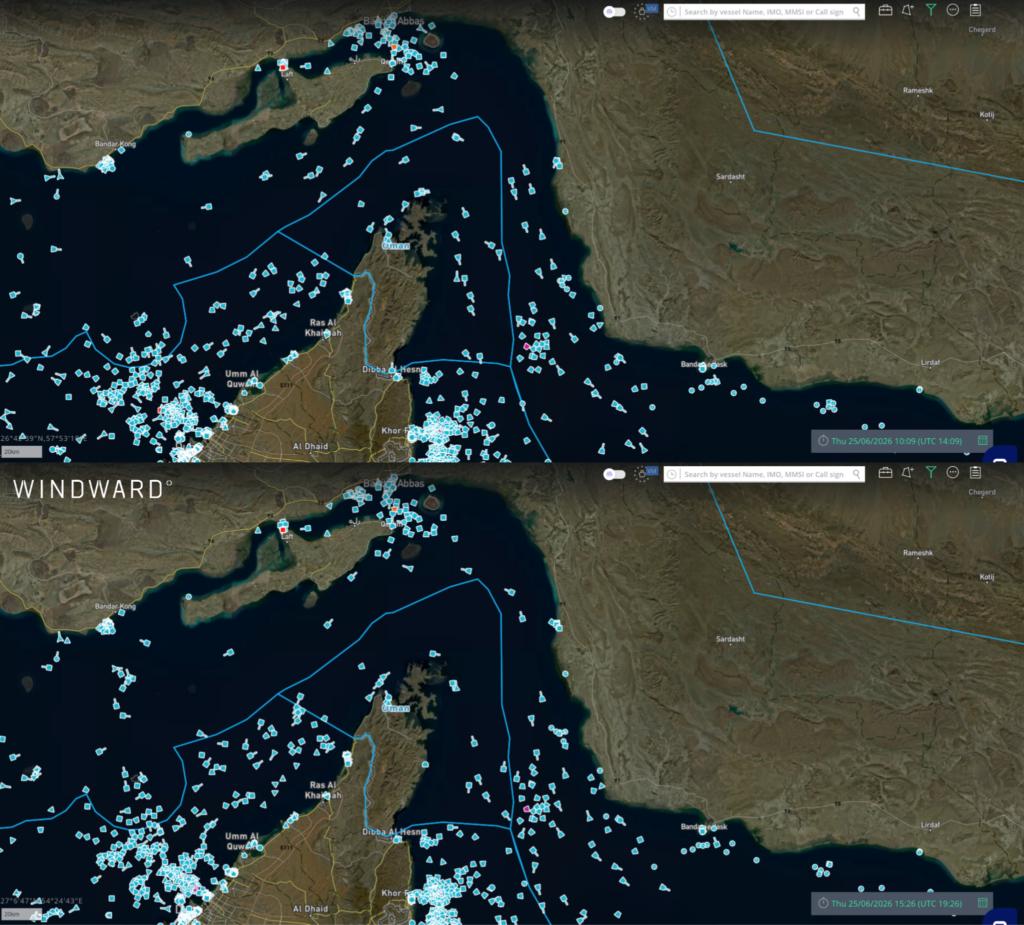
The IMO temporarily paused its vessel evacuation plan in direct response to the attack. In the hours following the incident, the central corridor cleared out, with vessels concentrating along the northern and southern coastal edges in a pattern consistent with operators vacating the exposed center lane.
On June 27, the Panama-flagged VLCC KIKU (IMO 9329796), a 333-meter vessel, was struck by a UAV approximately nine nautical miles north of Khasab, Oman, while transiting outbound laden with Qatari crude. The UAV impacted the vessel’s starboard bridge, causing minor damage, with no casualties reported and the vessel remaining seaworthy and continuing underway. KIKU had emerged from a 13.5-day dark period on June 26, transmitting AIS for approximately five hours before the strike, at which point it ceased transmission. The vessel was operated by a major international trading company and owned by a Liberian entity with Greek technical management, commercially neutral tonnage, and not Iran-affiliated. The strike on a non-sanctioned vessel carrying legitimate Gulf cargo represents a significant escalation in targeting parameters.
Hormuz after the MoU - VortexaThe June 17 Memorandum of Understanding (MoU) marked the clearest break in the Hormuz disruption that began in late February. For the oil market, the agreement mattered less as a diplomatic headline and more because it changed the practical conditions for moving cargo through the Gulf.In effect, the MoU created a temporary operating window. Commercial traffic through the Strait of Hormuz was able to resume more freely, immediate pressure around Iranian port calls eased, and the later sanctions waiver created a limited window for Iranian-origin crude, petroleum products and petrochemicals to move with fewer restrictions. Reports that Iran would not impose tolls during the initial 60-day window also removed another cost layer for shipowners and charterers.Tanker traffic responded almost immediately. But so far Vortexa’s tracking suggests the MoU has restored existing Gulf flows rather than created new ones. Volumes are recovering, particularly in crude, but the routes, buyers and vessel patterns still look broadly familiar. What it means for the marketSupply: Gulf crude is moving again in size. Post-MoU throughput through Hormuz approached roughly 20mbd on the busiest day, led overwhelmingly by crude. That points to incremental barrels reaching Asia after weeks of disruption. Freight: The recovery is concentrated in larger crude carriers, especially VLCCs and Suezmaxes. These are the vessel classes most likely to feel the first freight impact, as returning MEG crude flows add another layer of demand on top of existing long-haul Atlantic Basin-to-Asia trade. Risk: Reopened does not mean normalized. Dark crossings remain the majority of activity, alternative routing remains relevant, and sanctioned tonnage rose faster than overall traffic. For charterers, owners and compliance teams, the absolute risk pool has expanded even as mainstream traffic has returned. Traffic roughly tripled within a weekAcross Vortexa’s curated Hormuz transit record, covering 823 crossings between March 1 and June 23, average daily tanker crossings rose from just over 6 per day before June 17 to more than 20 per day after the MoU, a 224% increase. The busiest day, June 22, saw 36 crossings.The key signal is that both legs of the trade moved together. Outbound laden crossings rose 218%, rising from just over 3 per day to nearly 11 per day, while inbound ballast crossings rose 254%, from roughly two to three per day to 9 per day.That matters because this does not look like a one-off clearance of stranded cargo. Ships are leaving full and returning empty to reload. The ballast leg is the forward signal: if empty tankers keep returning through July, the export recovery has room to continue.
How we can help:
Thank you for your time. Regards, James Littlejohn Co-Founder Info@maritimedata.ai +44 (0)208 050 9806 You might be receiving this email because we believe that the content of our newsletter may be of interest to you based on your profession. However, if we have made an incorrect assumption, we apologise for any inconvenience caused. If you do not wish to receive future publications, please follow the instructions below to unsubscribe. |

Maritime Data Newsletter
A dedicated source of market insights and product developments from the largest network of specialised providers of maritime data and analytics.
Maritimedata.ai is a single source of access to 200+ data services. 200+ Products 60+ Maritime Intelligence Providers 30+ Years of Experience Explore our catalogue Insights 📈 Oil & Gas 🛢️ Oman’s Offshore Oil Trade (Link) Has The US Flipped The Script? (Link) Strait of Hormuz in April: A Stop-Start Recovery Under Persistent Risk (Link) Dry 🚢 South Asian demand keeps pushing coal flows higher (Link) Agri - Freight Recap: 12/06/2026 (Link) China Mineral Resources Group has reportedly told some...
Maritimedata.ai is a single source of access to 200+ data services. 200+ Products 60+ Maritime Intelligence Providers 30+ Years of Experience Explore our catalogue Insights 📈 Oil & Gas 🛢️ Import loss, stock build: How China absorbs the Hormuz shock (Link) From Supply Disruption to Transit Disruption: What April Reveals About the Global LNG Shock (Link) OFAC’s Crackdown on Chinese Teapot Refineries (Link) Dry 🚢 China’s soybean imports in March rose 14.9% (Link) Agri- Commodities: 27-01/05/26...
Maritimedata.ai is a single source of access to 200+ data services. 200+ Products 60+ Maritime Intelligence Providers 30+ Years of Experience Explore our catalogue Insights 📈 Oil & Gas 🛢️ The Clock is Ticking (Link) Asia crude slate shifts lighter as Middle East losses deepen (Link) Current Russian LNG Supply Picture (Link) Dry 🚢 Panamax Supply Outlook as Hormuz Faces Strain (Link) Dry Bulk Freight Recap: 17/04/2026 (Link) Other 🌎 Iran claims seizure of two MSC-operated boxships while...